What Information Is Available in the Dashboard?
The RHL ASM Platform dashboard provides a consolidated, at‑a‑glance view of your organization’s external exposure, detections, and trends.
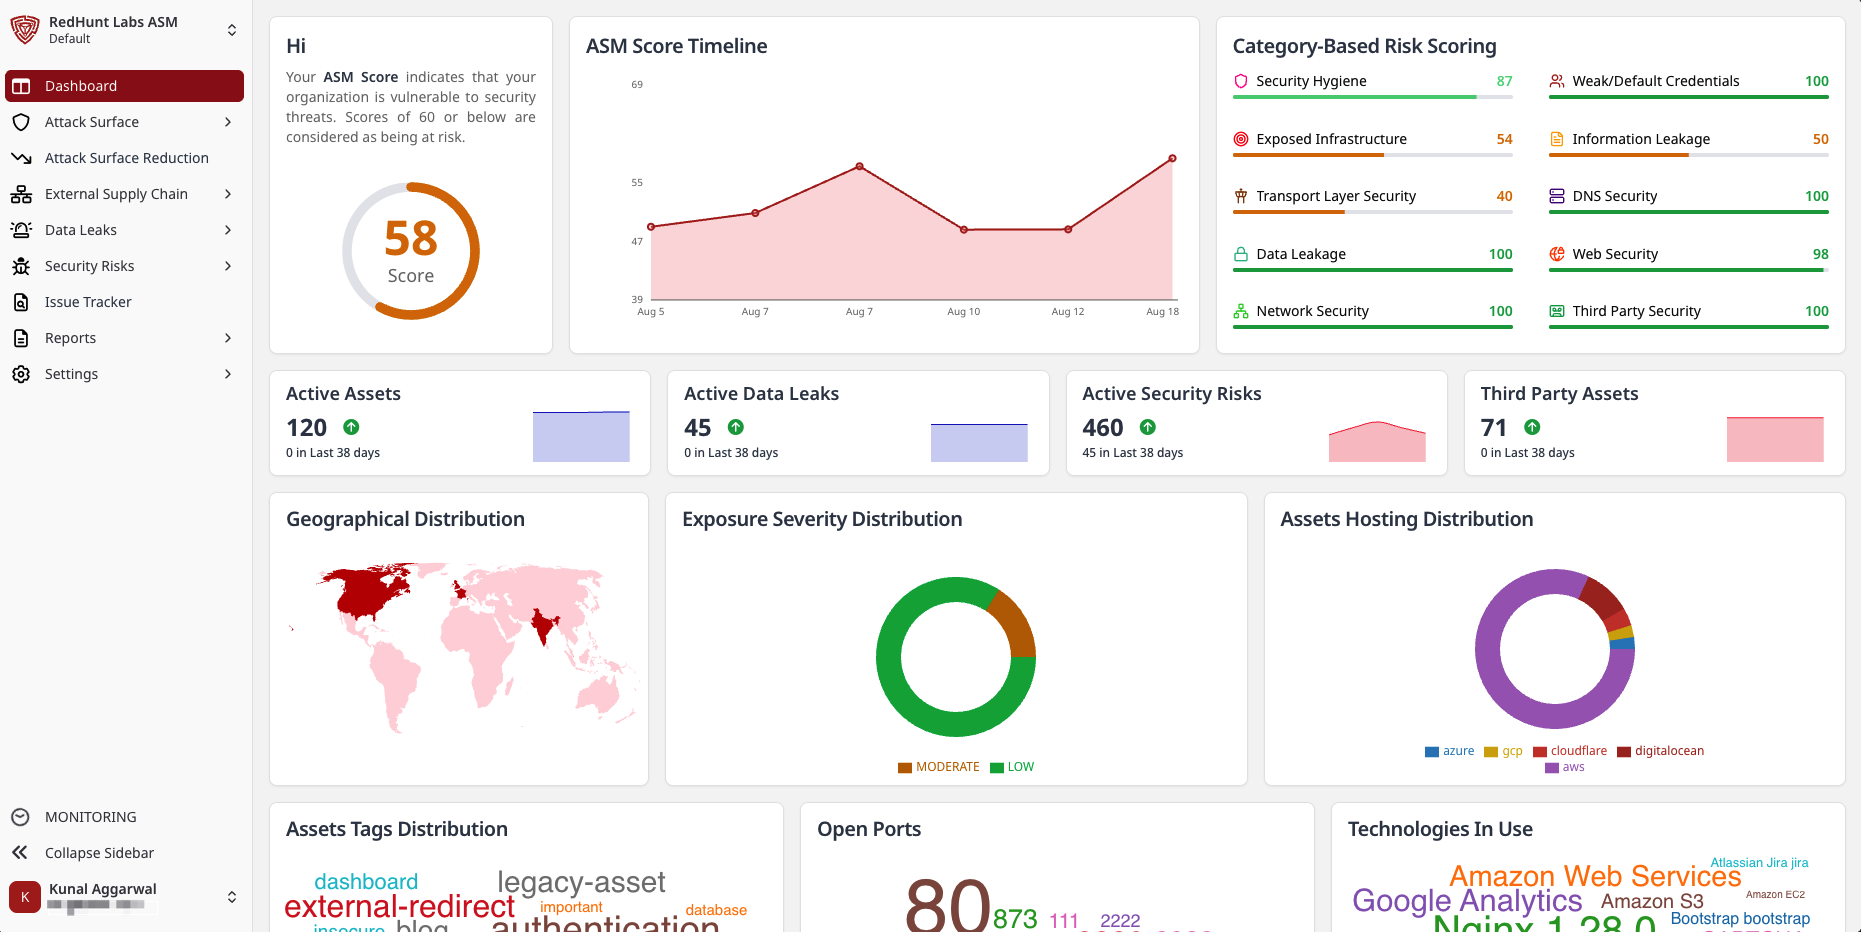
ASM Score
- Shows your organization’s overall attack surface score. A lower score indicates lower risk; scores ≥ 60 imply elevated risk and should be reviewed.
- Use the score as a quick health indicator and to track improvement over time.
ASM Score Timeline
- A line chart showing changes in your ASM score across recent scans.
- Hover over data points to see the exact score on specific dates.
Category‑Based Risk Scoring
- Normalized scores (0–100) across major categories such as Security Hygiene, Exposed Infrastructure, Transport Layer Security, DNS Security, Data Leakage, Network Security, Web Security, Weak/Default Credentials, Information Leakage, and Third‑Party Security.
- Use these to identify weak areas and prioritize remediation by category.
Number of Active Entities
- Active Assets: Total active assets and how many were newly discovered in the latest period.
- Active Data Leaks: Total active data leaks and recent new detections.
- Active Security Risks: Total active security risks and recent new detections.
- Third‑Party Assets: Count of third‑party assets currently detected.
Geographical Distribution
- A world map displaying IP counts of assets across regions.
- Hover to see the number of IPs per location.
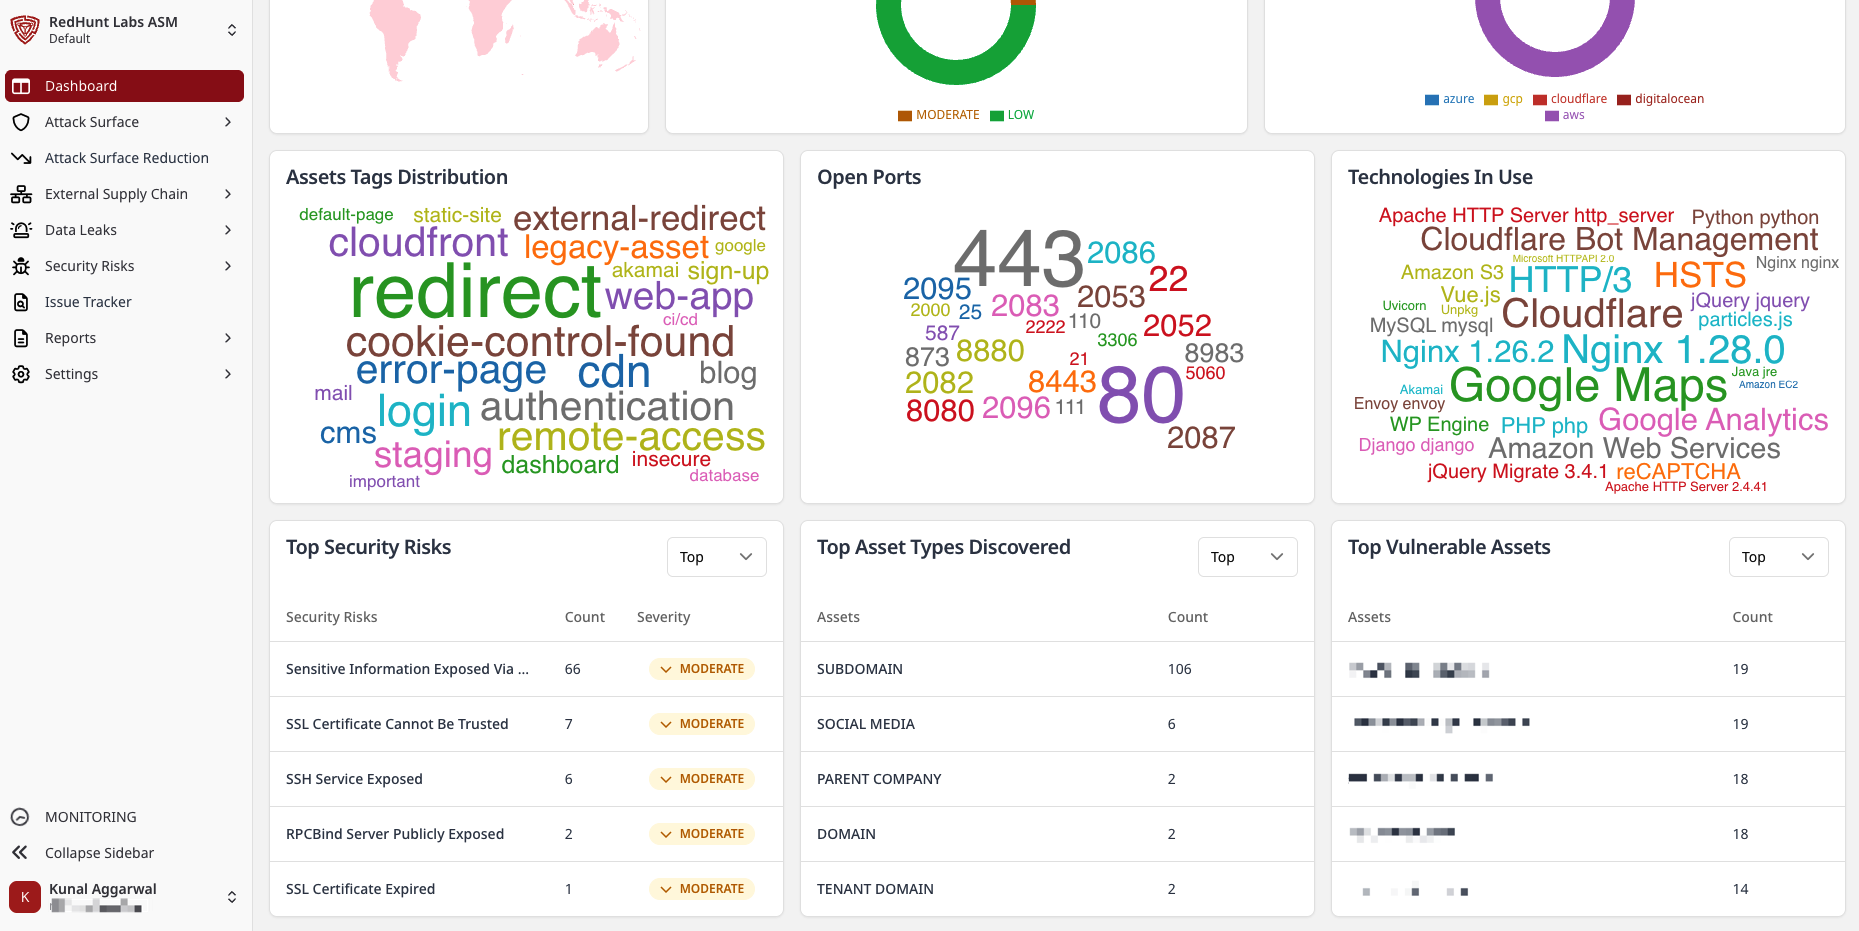
Exposure Severity Distribution
- A donut chart of vulnerabilities by severity (e.g., LOW, MEDIUM, HIGH, CRITICAL).
- Click on a severity to focus its segment.
Assets Hosting Distribution
- Distribution of assets by hosting provider (e.g., Azure, GCP, Cloudflare, DigitalOcean).
- Helps understand cloud/provider concentration.
Assets Tags Distribution
- A tag cloud showing the most frequently used asset tags.
- Helps spot dominant classifications or tagging gaps.
Open Ports
- A word cloud of commonly observed open ports across assets.
- Useful for spotting unusual or high‑exposure services.
Technologies In Use
- A technology cloud of frameworks, servers, libraries, and platforms detected across assets.
- Helps identify tech stack diversity and concentration.
Top Security Risks
- Table of the most active/critical security risks with count and severity.
- Click a risk to open Security Risks ⟶ Detailed View.
Top Asset Types Discovered
- Table of most frequently detected asset types with counts.
- Click an asset type to view associated records.
Top Vulnerable Assets
- Assets sorted by number of associated vulnerabilities.
- Click an asset to view full details on Asset Exposure.